

Illustration by Hilary Fung
More Floods, More Drought Inevitable. How Bad Do We Want It To Get?
MONDAY, NOV. 30, 2015, 8:30 AM EDT
World leaders are meeting in Paris this month in what amounts to a last-ditch effort to avert the worst ravages of climate change. Climatologists now say that the best case scenario — assuming immediate and dramatic emissions curbs — is that planetary surface temperatures will increase by at least 2 degrees Celsius in the coming decades.
This may sound like a small uptick, but the implications are profound. Rising temperatures will destroy plant and animal habitats, and reduce yields of important food crops. More people will be exposed to the ravages of flooding and drought.
But if the nations involved in the Paris talks stay on their current emissions track and don’t reduce greenhouse gas emissions, temperatures could go up by almost 6 degrees Celsius this century, according to the Committee on Climate Change, an independent body that advises the U.K. government on climate issues.
The consequences of a heating globe are already being felt in Alaska, which is warming twice as fast as the rest of the U.S. Rising temperatures have thawed frozen soil in some areas, leaving coastlines vulnerable to storms and tidal activity. Shishmaref, a remote village that sits on an island 30 miles outside the Arctic circle, is losing as many as 9 feet of land a year — chunks of coastline that simply break into the sea.
Plant And Animal Habitats Face Dire Threat From Warming Climate
Each year, more species are losing their habitats to climate change. An increase of 4 degrees Celsius in average planetary temperatures could result in severe habitat loss for almost two-thirds of plant species and one-third of mammal species.
+2 degrees +4 degrees

Loss of crop yields
60%
40%
20%
0%
MAIZE
SPRING WHEAT

Species losing at least half their habitat
60%
40%
20%
0%
PLANTS
MAMMALS
Source: Committee on Climate Change
Crop estimates assume that crop varieties and planting times are adjusted to optimize yeild. Plant and animal estimates assume that species disperse to new areas at historically observed rates. Charts show median estimates.
More People Threatened By A Warming Planet
Even if nations meeting in Paris curtail carbon emissions, a growing number of communities will be exposed to threats caused by climate change. Vulnerable populations that live near water or in arid places will face massive disruptions to their way of life: Flooding and severe drought are on course to become much more common.
+2 degrees +4 degrees

COASTAL FLOODS
An estimated 2 million to 13 million
people each year will be
exposed to flooding
Roughly equal to the
population of...
New Orleans and
southern Louisiana
...Louisiana, Mississippi
and Alabama

RIVER FLOODS
About 130 million to 250 million
people each year will be
exposed to flooding
...the entire South and
part of the Northeast
...the entire East and
Midwest of the U.S.

WATER STRESS
An estimated 1.5 billion
to 2 billion people each year will live
in areas without enough usable water
...almost five times
the U.S.
...six times the U.S.
Source: Committee on Climate Change, Census Bureau (population estimates). Charts show median estimates.
1. Coastal flood estimates assume that flood protections evolve with population and wealth.2. River flood estimates assume that protections do not evolve.
The World’s Biggest Emitters
Human activity since industrialization has led to a huge increase in the production of carbon dioxide, a greenhouse gas that contributes to rising global temperatures. Scientists warn that if carbon dioxide and other greenhouse gas emissions continue to rise at their current rates, Earth’s temperatures could increase dramatically in future decades, leading to catastrophic and irreversible climate change.
The 10 largest emitters produced about 26.4 gigatons of carbon dioxide in 2013. (A gigaton is 1 billion tons, or roughly the equivalent of the annual emissions from every passenger car in the U.S. each year.) They are highlighted in red.


European
Union
3.48
Russia
1.81
Canada
0.50
South Korea
0.61
Iran
0.61
5 GtCO2/yr
United States
5.23
China
9.97
2.5
Japan
1.24
1
0.25
Saudi Arabia
0.51
India
2.40
Largest producers per person
In tons of CO2 per person
Qatar is the
largest per capita
producer of CO2
Qatar
Trinidad and Tobago
Kuwait
Brunei
Aruba
40.28
36.47
29.86
25.24
22.53
5 GtCO2/yr
2.5
1
0.25
European Union
3.48
Russia
1.81
Canada
0.50
South Korea
0.61
Iran
0.61
United States
5.23
China
9.97
Japan
1.24
Saudi Arabia
0.51
India
2.40
Russia
1.81
European Union
3.48
China
9.97
United States
5.23
India
2.40
Source: Boden, TA, G Marland, and RJ Andres. 2013. Global, Regional, and National Fossil-Fuel CO2 Emissions. Carbon Dioxide Information Analysis Center (CDIAC), Oak Ridge National Laboratory, US Department of Energy, Oak Ridge, Tenn., USA doi:10.3334/CDIAC/00001_V2013, via Global Carbon Atlas
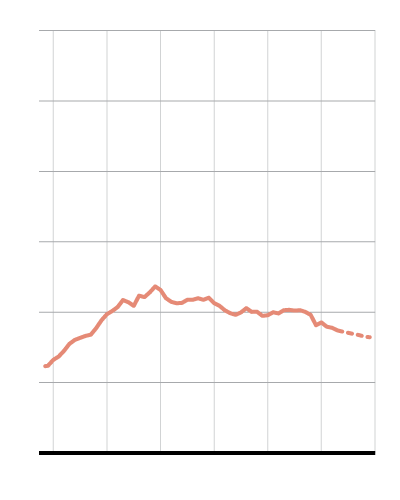
Countries Producing Most Of The World’s Carbon Promise Big Cuts
Countries responsible for two-thirds of global emissions have made commitments to curb their greenhouse gas production. That group includes some of the biggest emitters like China, India and the U.S.
China, the world’s biggest carbon producer, has promised that its carbon emissions will peak by 2030.
Projected emissions by 2019, in gigatons of carbon dioxide
12
10
12.7
China: 12.7
8
6
4
2
0
1960
2020
China will aim to reach maximum carbon emissions by 2030. After that, it will lower its carbon dioxide emissions by 60 to 65 percent relative to 2005 levels.

12
10
8
6
4
5.2
U.S.: 5.2
2
0
1960
2020
By 2025, the U.S. aims to reduce greenhouse gas emissions by 26 to 28 percent relative to 2005 levels.
12
10
8
6
4
3.3
E.U.: 3.3
2
0
1960
2020

12
10
8
6
3.4
India: 3.4
4
2
0
1960
2020
Source: CDIAC/GCP/Friedlingstein et al 2014, via Global Carbon Project
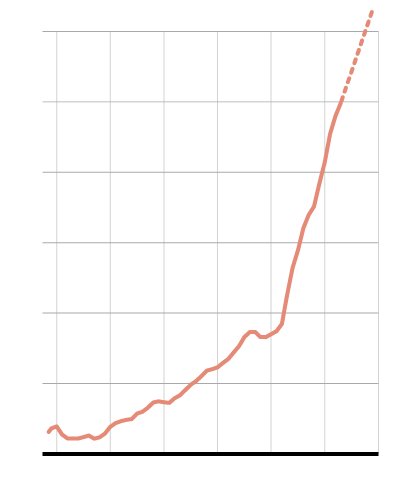
Fossil Fuels Triggering Rapidly Rising Temperatures
Limiting global temperature increases requires reducing carbon emissions. Global fossil fuel and cement consumption are leading drivers of emissions -- combined, they've risen about 60 percent since 1990. The Global Carbon Project calculates that emissions from these sources will continue to rise.
The green, orange and yellow lines indicate how surface temperatures will likely respond if leading carbon emitters begin to reduce reliance on fossil fuels. Without immediate curbs, temperatures are set to follow the red track, and increase between 3.2 and 5.4 degrees Celsius by 2100. The green line shows how we can minimize warming if emissions immediately drop -- a highly unlikely scenario.
Global fossil fuel and cement emissions, in gigatons of carbon dioxide


3.2−5.4°C
3.2−5.4°C
100
100
100
warming
relative to
1850–1900
warming relative to 1850–1900
80
80
80
60
60
60
2.0−3.7°C
2.0−3.7°C
2014 estimate
2014 estimate
40
40
40
20
20
20
Historical emissions
Historical emissions
1.7−3.2°C
1.7−3.2°C
0
0
0
0.9−2.3°C
0.9−2.3°C
Net-negative global emissions
-20
-20
-20
1860
1860
1860
1880
1900
1920
1920
1940
1960
1980
1980
1980
2000
2020
2040
2040
2060
2080
2100
2100
2100
Source: CDIAC/GCP/Friedlingstein et al 2014, via Global Carbon Project